How International Trade Shaped France’s Carbon Footprint
This post is a reproduction of the English version of the Lettre du CEPII 457.
France stands out for the significant role that imports play in the dynamics of its carbon footprint. Between 2000 and 2014, trade openness worsened France’s carbon footprint, in particular because of the rapid growth of Chinese imports until 2008. At the same time, technological progress within France, but especially abroad, led to a modest reduction in the carbon footprint. For a relatively low-emitting country like France, changes occurring outside the national borders play a key role in the evolution of the carbon footprint. This observation highlights the need to coordinate national efforts with international strategies to reduce emissions linked to the production of our trade partners.
Globalization is changing the way we measure emissions
Globalization has progressively separated where goods are consumed from where greenhouse gases are emitted during production. At the national level, emissions are traditionally measured where they are produced (the “national inventory” approach). Alternatively, emissions can be measured where goods and services are consumed: the “carbon footprint” approach. The carbon footprint attributes emissions to a country’s demand, including emissions embedded in imports and excluding those embedded in exports. If a country’s carbon footprint exceeds its national inventory, more greenhouse gases are embedded in its imports than in its exports.
The rise of international trade in recent decades has led to a growing divergence between national inventories and countries’ carbon footprints. This gap is particularly pronounced for France: between 2000 and 2014,1 its territorial emissions decreased by 18%, while its carbon footprint dropped by only 5%. In 2014, emissions within the national territory amounted to 452 million tonnes of CO₂ equivalent (Mt CO₂e), whereas France’s carbon footprint stood at 680 Mt CO₂e. The difference between these two indicators, 228 Mt CO₂e, represents the country’s net imports of greenhouse gases: France exports 136 Mt CO₂e through its sales of goods and services abroad and imports 364 Mt CO₂e.
A country’s carbon footprint can be divided into two components: emissions from domestic consumption (goods and services produced and consumed within its borders) and imported emissions, embedded in goods and services originating from other countries.2 In 2014, imported emissions accounted for 54% of France’s total carbon footprint (364 out of 680 Mt CO₂e). This is a notably high share compared to other countries with similar levels of development. Between 2000 and 2008, France saw a sharp rise in the proportion of imported emissions in its carbon footprint, which increased from 45% to 54% (Figure 1). From 2008 to 2014, this share remained relatively stable, with just over half of France’s carbon footprint linked to foreign production. This figure is more than double the global and U.S. averages, which hover around 25%. The share of imported emissions is also higher in France than the average in the European Union, although France and the EU have followed similar overall trends.
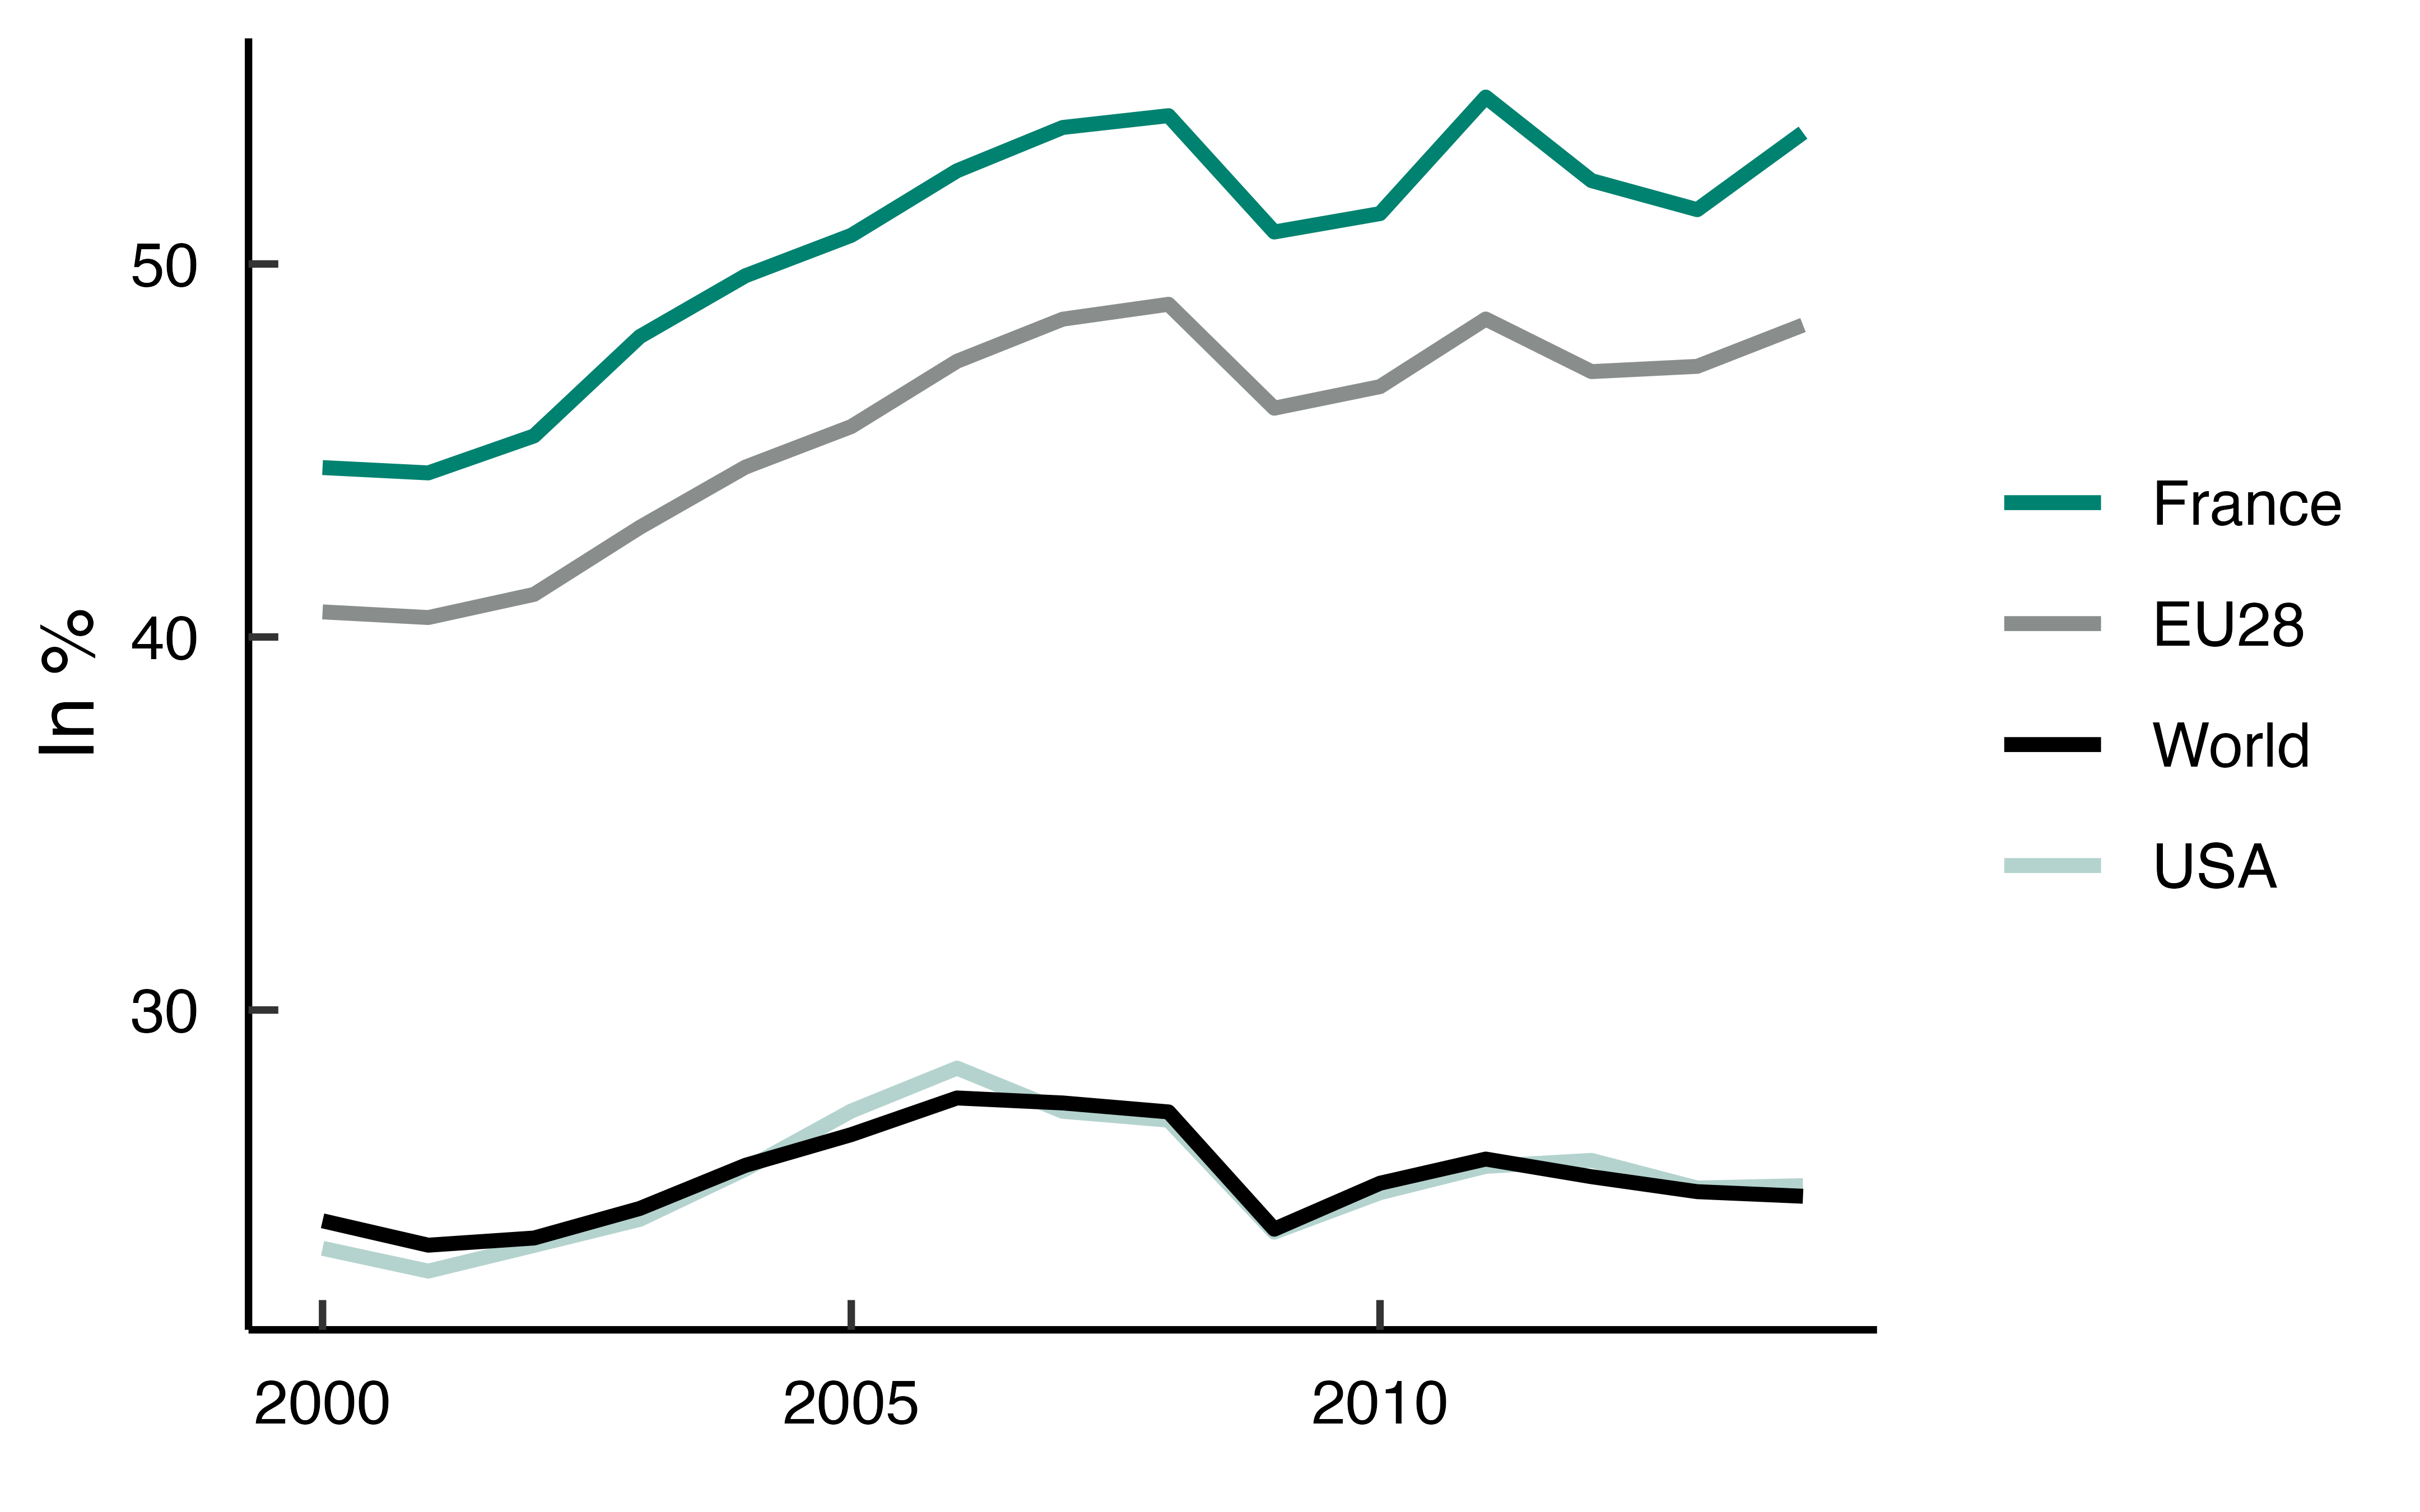
Subtitle: Greenhouse gas imports as a percentage of the carbon footprint.
Notes: The carbon footprint includes the majority of greenhouse gases (carbon dioxide, methane, nitrous oxide). The value for the EU-28 corresponds to the ratio between total imported emissions and the total footprint of the 27 EU member states plus the United Kingdom. Each country’s imports include intra-European trade flows.
Source: Authors’ calculations, see Cotterlaz and Gouel (2026).
Where are the greenhouse gases generated by French demand emitted? Primarily in other European countries, though emissions linked to imports from China have grown significantly in recent years (Table 1). About 15% of France’s carbon footprint originates from goods and services produced in other EU member states, a share that remained steady from 2000 to 2014. In contrast, emissions associated with imports from China rose sharply, tripling between 2000 and 2008, from 19 to 62 Mt CO₂e, before stabilizing at 49 Mt CO₂e in 2014. While Chinese imports accounted for less than 3% of France’s carbon footprint in 2000, they represented 7% of this footprint by 2014. Emissions from the rest of the world became more prominent: their share of France’s carbon footprint rose from 26% to 32% between 2000 and 2014.
French greenhouse gas emissions are increasingly imported, particularly from China.
Subtitle: Contribution by country to France’s carbon footprint.
Source: Author’s calculations from WIOD 2016, Eurostat, and EXIOBASE.
| Share of French carbon footprint emitted in: | |||||
|---|---|---|---|---|---|
| Year | France | UE28 | China | Other countries | Total footprint (Mt CO₂e) |
| 2000 | 55 | 16 | 3 | 26 | 707 |
| 2008 | 46 | 14 | 8 | 32 | 805 |
| 2014 | 46 | 15 | 7 | 32 | 680 |
The drivers behind the dynamics of the carbon footprint
Changes in France’s carbon footprint result from a combination of several factors: total demand, the nature of the products consumed (a shift toward a more carbon-intensive sector increases the footprint), supply chains (production may take place in countries with higher or lower emissions), and of course, technological progress. Understanding the relative importance of each of these factors is essential for identifying the public policies needed to reduce the carbon footprint.
For example, the rising share of imported emissions in France’s carbon footprint could be due either to an increase in imports or to efficiency gains in domestic production, which would make it less emission-intensive. These two scenarios suggest very different policy responses. The methodology we developed makes it possible to distinguish the effects of these various factors by identifying the respective contributions of:
- changes in the geographic composition of France’s supply chains: the share of each country in French final demand and the share of imports in final demand (openness rate);
- the sectoral composition of demand: the share of each sector in final demand;
- technological progress: the emission intensity of each sector, i.e., greenhouse gas emissions per euro of output;
- total French demand, which reflects both population growth and per-capita consumption.
To isolate the contribution of each component, a “structural decomposition analysis” is carried out. Using input-output tables from the WIOD 2016 database, which describe the flows of goods and services for intermediate or final consumption across countries and sectors, we calculate the contribution of each factor to the change in France’s carbon footprint between a given year and the previous one.3 This approach makes it possible to assess how the carbon footprint would have evolved if certain parameters had remained fixed at their previous year’s value.
For example, we can estimate how France’s carbon footprint would have changed between 2000 and 2001 if the openness rate had remained at its 2000 level in 2001. This is interpreted as the contribution of trade openness to the change in France’s carbon footprint between 2000 and 2001. To determine the cumulative contribution of this factor over a longer period, its annual contributions are summed. This yields the total contribution of trade openness to the change in France’s carbon footprint over the period, assuming the openness rate had remained each year at the level of the previous year.
This analysis shows that shifts in the geographic composition of France’s supply chains were a key factor driving changes in the country’s carbon footprint (Figure 2).4 Before 2008, this was due to a geographic reallocation effect: within French imports, sourcing shifted toward more carbon-intensive trading partners. Since 2008, the increase in emissions has been mainly driven by a higher trade openness rate: overall, France has been importing a larger share of its consumption.
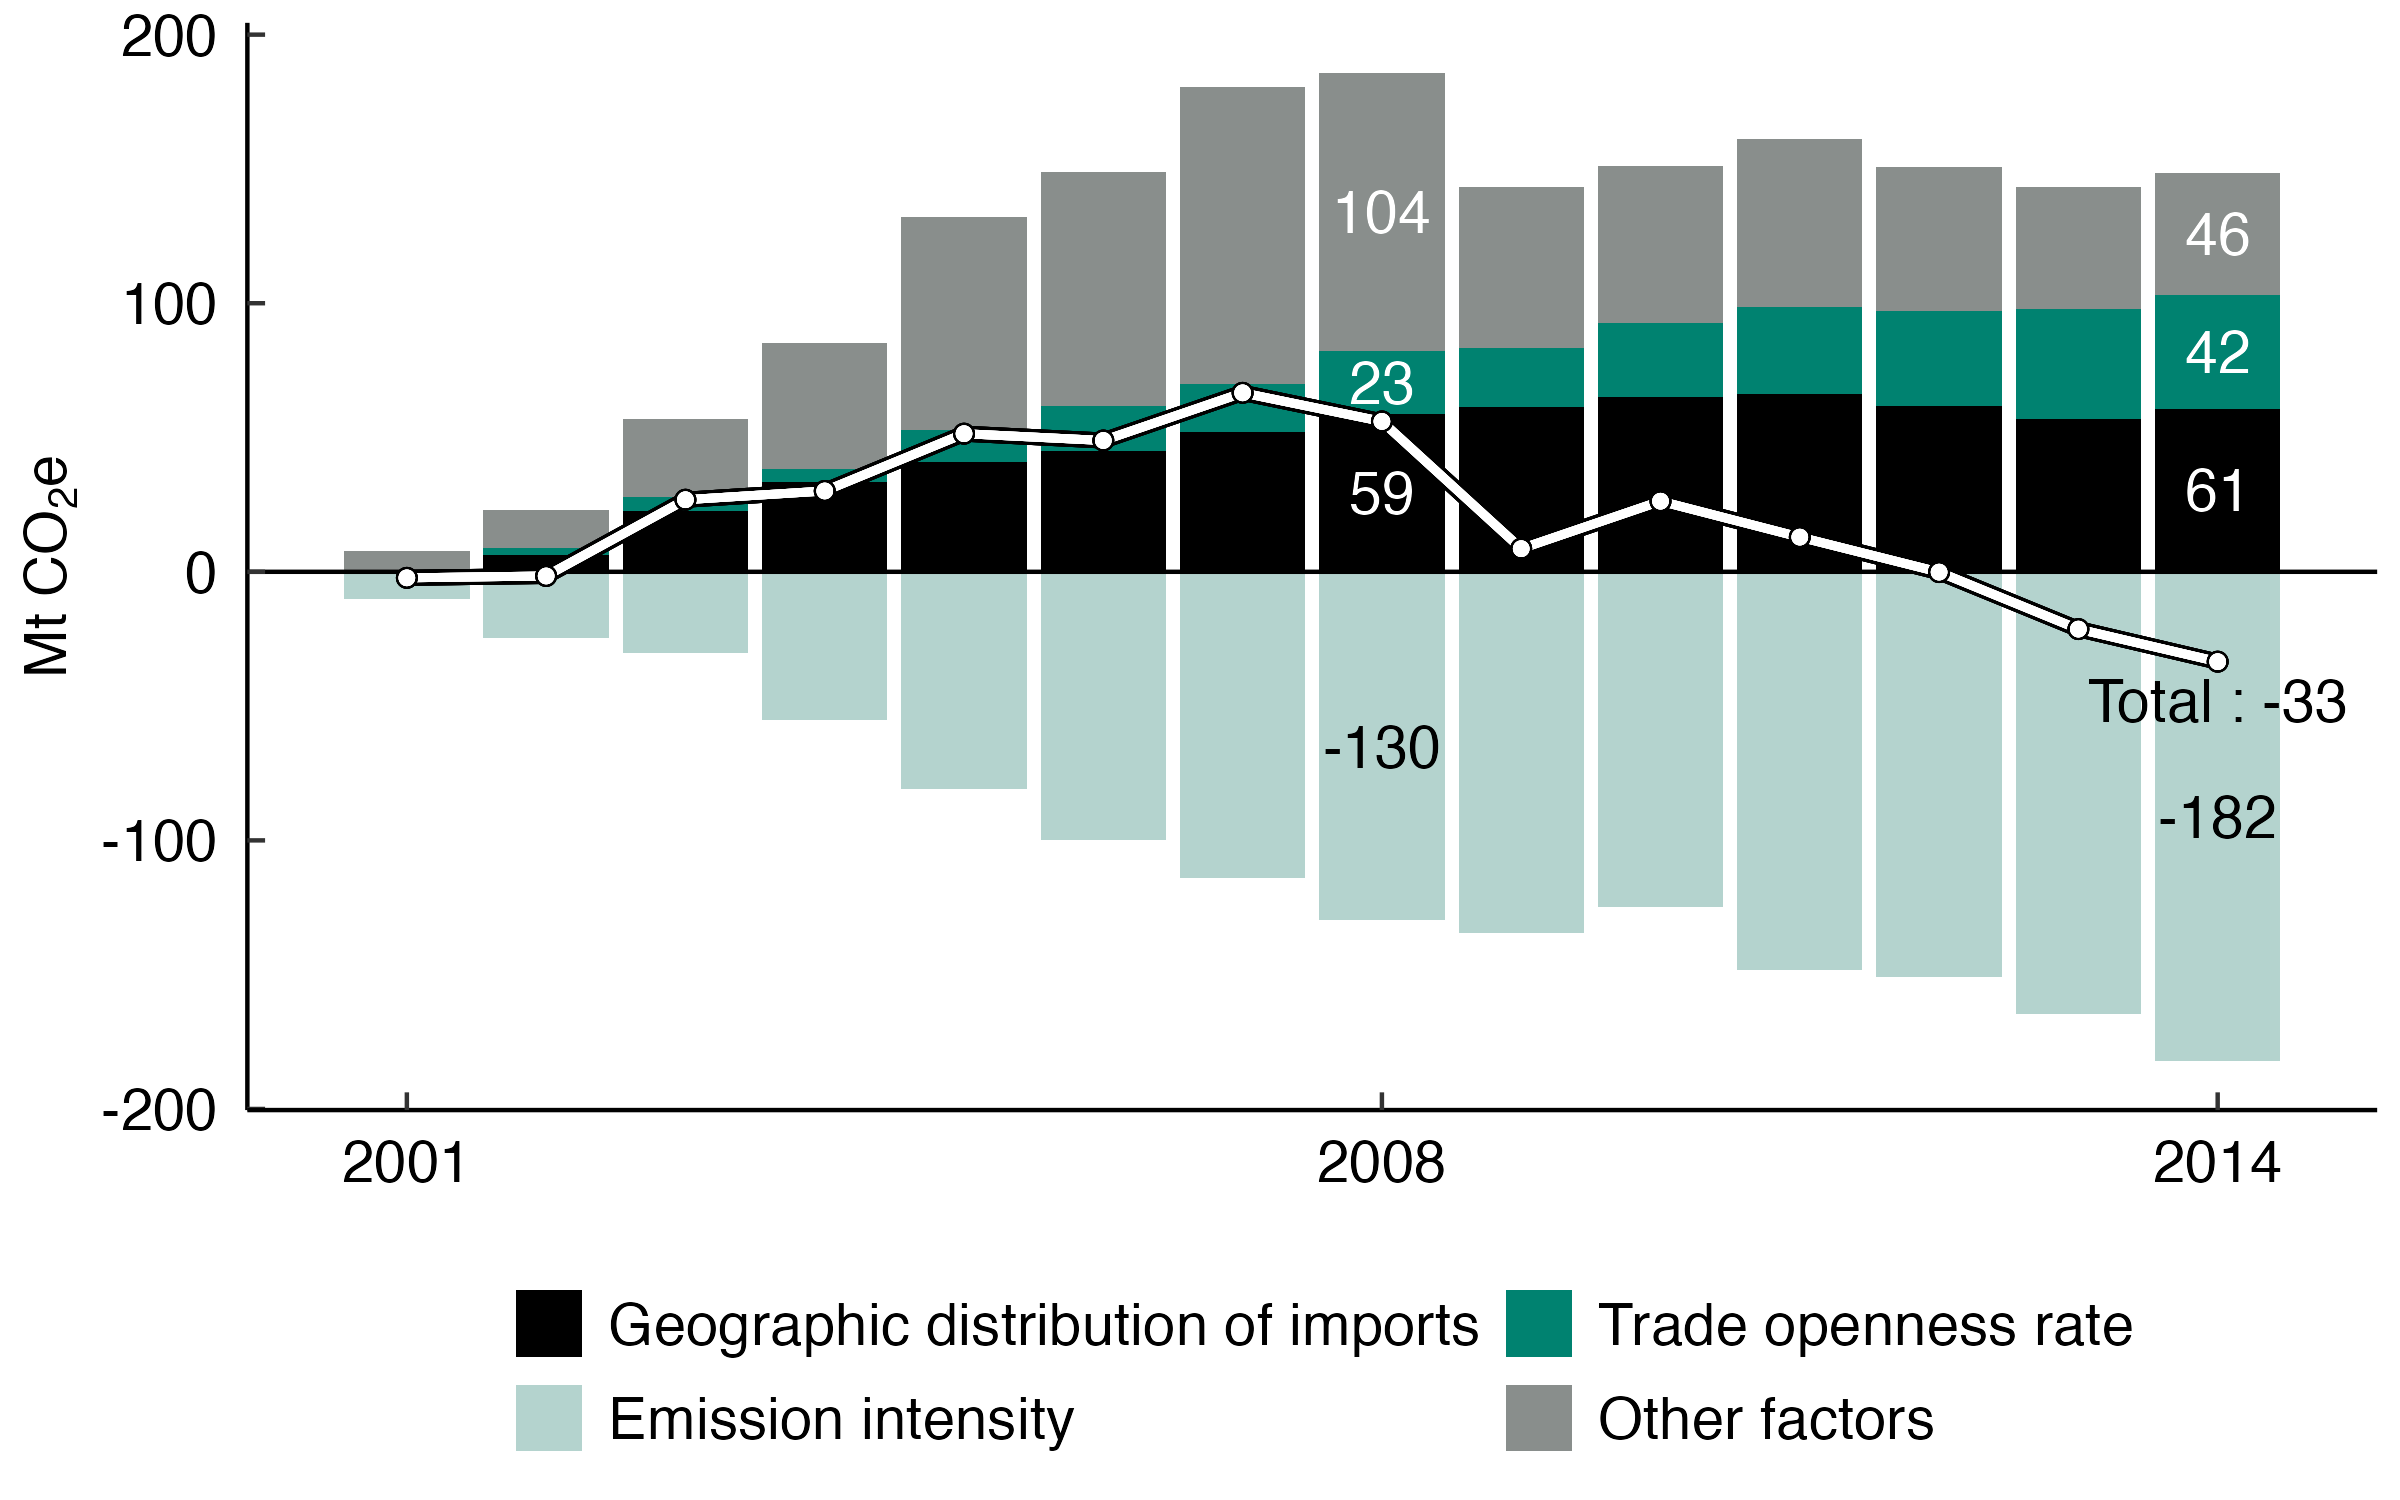
Subtitle: Cumulative contribution to France’s carbon footprint, in Mt CO₂e.
Notes: Each bar represents the cumulative contribution to France’s carbon footprint since 2000. Shown separately are the effects of the geographic reallocation of French imports (changes in the share of each country in French imports), France’s trade openness (defined as the share of imports in French final demand), emission intensity (greenhouse gas emissions per euro of output), and other factors.
Source: Authors’ calculations based on WIOD 2016, Eurostat, and EXIOBASE.
In the early 2000s, China emerged as a key player in global trade: its share of global exports of goods and services rose by 5 percentage points, from 3.7% in 2000 to 8.7% in 2008. This “China shock” was reflected in French imports: China’s share in France’s supply mix rose from 1.8% to 4.3% over the same period. Since production in China is associated with high levels of greenhouse gas emissions, the growing share of Chinese imports in France’s supply chain contributed to a deterioration of France’s carbon footprint.
Between 2000 and 2008, the reallocation of market shares among France’s trading partners led to a 59 Mt CO₂e increase in the carbon footprint, more than half of that increase being linked to the rising share of Chinese imports among French imports (Figure 3).
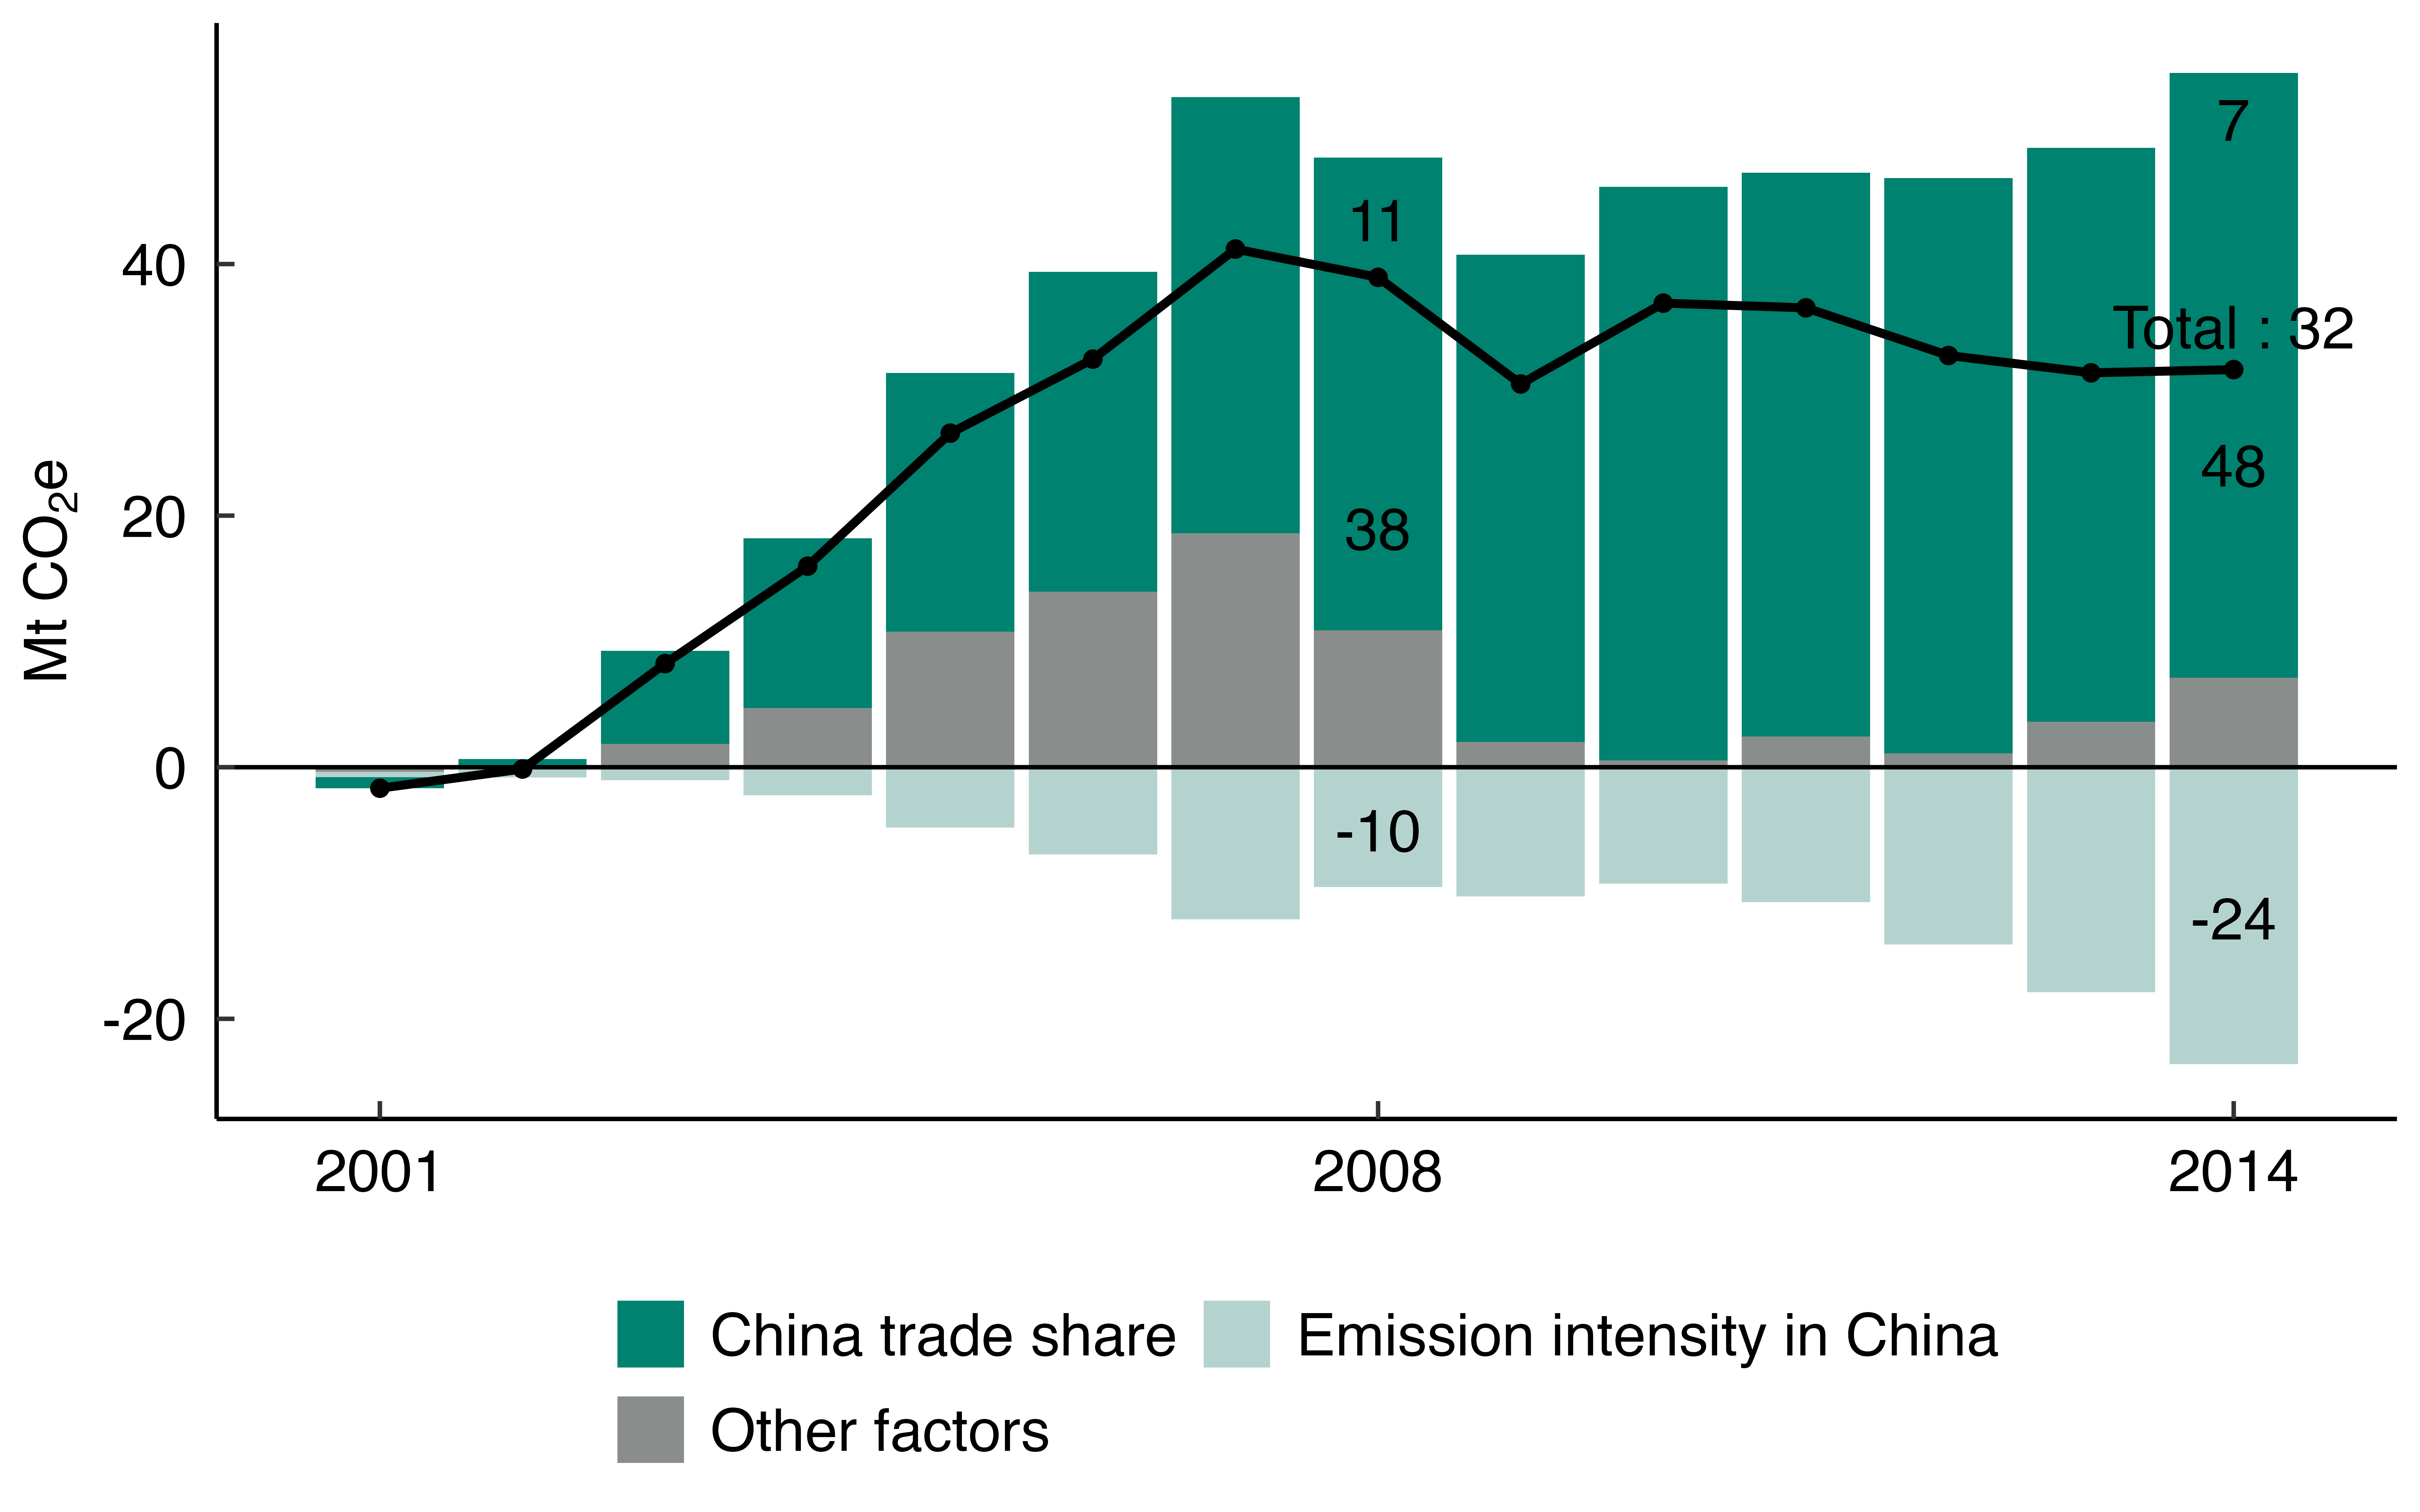
Subtitle: China’s cumulative contribution to France’s carbon footprint, in Mt CO₂e.
Notes: Each bar represents China’s cumulative contribution to France’s carbon footprint since 2000. The effects are broken down into the change in China’s share of French consumption (goods and services), technological progress in China, and all other factors (such as the size of the French economy, etc.).
Source: Authors’ calculations based on WIOD 2016, Eurostat, and EXIOBASE.
After 2008, the main factor driving the increase in France’s carbon footprint is the rise in trade openness (Figure 2). From that point on, the share of each country in France’s supply mix becomes more stable, marking the end of the “China shock.” However, France continues to import an increasingly large share of its consumption: the share of imported goods consumed in France rose from 39% in 2000 to 47% in 2014. When considering both goods and services, the import share increased from 13.8% to 15.4%. This growing reliance on imports contributed to a 42 Mt CO₂e increase in France’s carbon footprint between 2000 and 2014.
The increase in France’s carbon footprint due to trade, along with other factors (particularly economic and population growth), has been offset by a decline in emission intensity, both in France and abroad, which ultimately became the dominant factor by the end of the period.
Most of the improvement in France’s carbon footprint came from abroad
For a country like France, which has already significantly decarbonized its electricity production and relies heavily on imports, much of the progress in reducing its carbon footprint has occurred beyond its borders. In fact, technological improvements abroad contributed more to reducing France’s consumption-based emissions than those made domestically. Overall, between 2000 and 2014, the decrease in emission intensity reduced France’s carbon footprint by 182 Mt CO₂e (Table 2). Of this reduction, 76 Mt came from changes in emission intensity within France, while the remaining 106 Mt resulted from technological gains abroad. European partners played a key role: their technological progress reduced France’s footprint by 40 Mt, while China also contributed significantly, accounting for a 24 Mt decrease.
Technological progress abroad contributes more to the reduction of France’s carbon footprint than technological progress in France.
Subtitle: Cumulative contribution over the period 2000–2014 of the change in emission intensity in each country to the variation in the French carbon footprint (in Mt CO₂e).
Notes: Between 2000 and 2014, the change in emission intensity in France helped reduce the French carbon footprint by 76 Mt CO₂e.
Source: Cotterlaz and Gouel (2026).
| Country | Contribution of technical change |
|---|---|
| France | -76 |
| EU28 (without FR) | -40 |
| China | -24 |
| Rest of the world | -42 |
| Total | -182 |
This trend likely foreshadows what lies ahead for other developed economies as they advance in their domestic decarbonization efforts. As territorial emissions decrease, the relative importance of imported emissions mechanically increases.
In 2000, France ranked among the countries with the lowest emission intensity: on average, each dollar of production in France was associated with 0.18 kg CO₂e, compared with a global average of 0.51 kg CO₂e per dollar. Among the 43 countries in the WIOD 2016 database, only four had lower emissions per dollar of output than France. This early decarbonization profile puts France in a position where further domestic reductions become more costly and imported products are increasingly likely to be produced with higher emission intensity than their domestic equivalents.
A negative relationship can thus be observed between a country’s average emission intensity and the share of imported emissions in its carbon footprint.5 Moreover, the more efficient a country is in terms of emissions, the greater the impact of foreign emission intensity on reducing its overall carbon footprint (Figure 4). France in 2000 is a textbook case: it exemplifies the path that most advanced economies are likely to follow. By 2014, the average emission intensity in OECD countries had already fallen to 0.15 kg CO₂e per dollar, significantly lower than the global average of 0.28 kg CO₂e per dollar, bringing them closer to the situation France experienced in 2000.
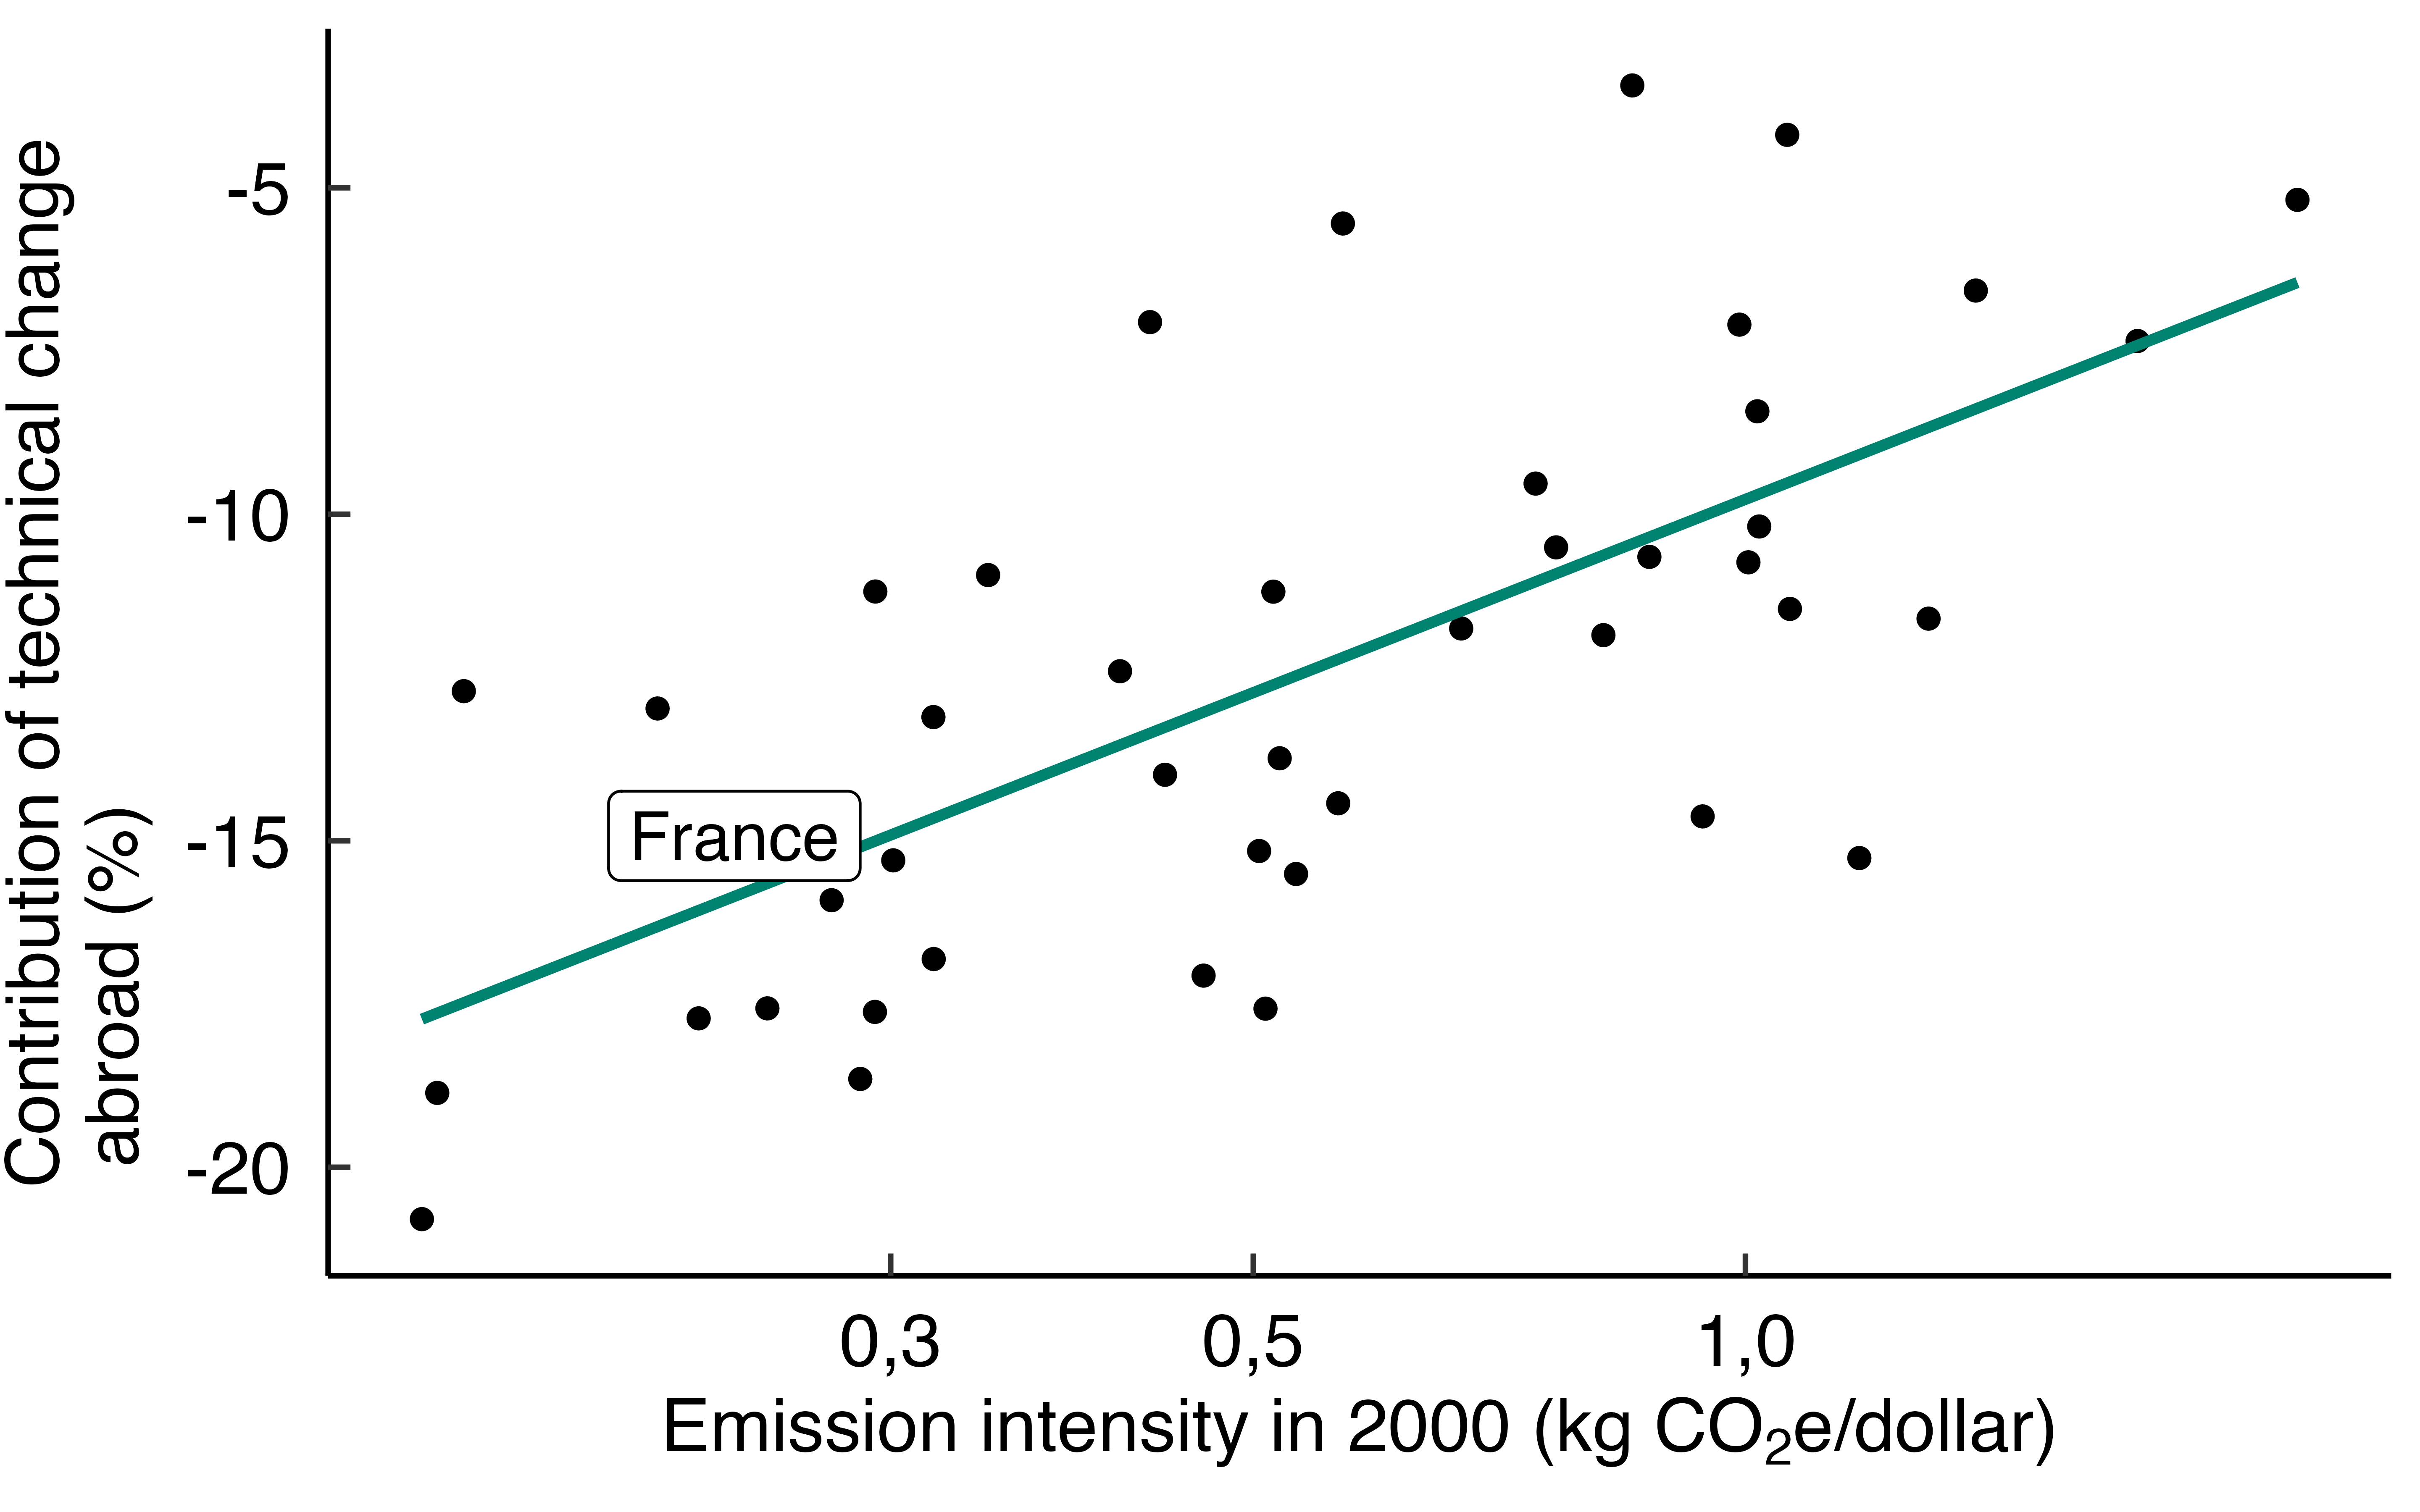
Subtitle: Relationship between the contribution of foreign technological progress to the carbon footprint (cumulative from 2000 to 2014 and relative to the 2000 footprint) and emission intensity in 2000.
Notes: Each point represents a country. The x-axis is on a logarithmic scale. The line shows the ordinary least squares estimate of the linear relationship between the contribution of foreign technological change and the logarithm of emission intensity. To neutralize sectoral composition effects, each country’s emission intensity is calculated using global sectoral shares in 2000.
Source: Cotterlaz and Gouel (2026).
Current decarbonization policies, such as the European “Fit for 55” package or France’s “National Low-Carbon Strategy,” focus primarily on domestic emissions inventories, overlooking a crucial dimension: imported emissions. To effectively reduce their carbon footprints, advanced economies must move beyond traditional territorial commitments by aligning national decarbonization efforts with international strategies that address emissions generated by their trading partners.
For France, this may involve implementing border carbon adjustment mechanisms, promoting low-carbon technology transfers to emerging economies, and strengthening coordination between trade and climate policies.
References
Footnotes
Our sample is limited to this period, which is the only one for which we have information at constant prices, necessary for the remainder of the analysis.↩︎
Here, in calculating the carbon footprint, emissions related to international freight transport cannot be properly taken into account due to the inability to distinguish GHG emissions related to transport at the bilateral level. For more details on the methodology, see Cotterlaz and Gouel (2026).↩︎
For a more detailed description of our methodology, see Cotterlaz and Gouel (2026).↩︎
The total change in the French footprint appears slightly different between Table 1 and Figure 2 (33 Mt CO₂e instead of 27 Mt CO₂e), because the figure is produced using input–output tables at previous-year prices, which affects the footprint calculation.↩︎
A country’s emission intensity is calculated by combining its sectoral emission intensities with each sector’s share in global production in 2000, in order to neutralize differences in sectoral composition between countries.↩︎